


Real-time information transfer
The system enables the live data system to connect with selected databases so that the data presented in the reports is constantly updated.

From financial planning to sales and marketing. Thanks to advanced data analysis, it allows you to track changes and view the most important information in real time. It is a solution for the presentation and analysis of company data from various sources. Thanks to this, we can get a comprehensive picture of the company. Based on this, we can plan activities and forecast the company’s results more effectively.

Real-time information transfer

Connecting data models

Building analyzes

Provision of information on maps

Built-in predictive functions

Built-in scheduling functions
The software is presented as a SaaS service, thanks to which we have access to the application from anywhere in the world via a web browser and a mobile application.
Moreover, the system is prepared for the growing trend of storing data in many places at once, because we have online stores, website statistics, highly developed pages on social networks, external specialized systems or MS Excel files, without which the company does not function today. Due to the possibility of combining the tool with various data sources and then data modeling, it can combine the data or use it to perform analyzes.
The system enables two types of connections:


Depending on which of the areas of our organization we want to measure and analyze, then we will set a different goal, but it may happen that when we set as a goal optimization of costs in the organization, we can analyze several departments in the organization, as in the case of costs of the organization, we will measure data from HR department, data from operational purchasing or cost services, and even production or sales staff costs.
However, if we set a goal to measure the sales funnel or, for example, a more specific one, such as measuring employee costs in relation to the value of gross revenues, e.g. in the catering industry, we can obtain very detailed information about the state of our organization in order to anticipate potential problems and avoid them.
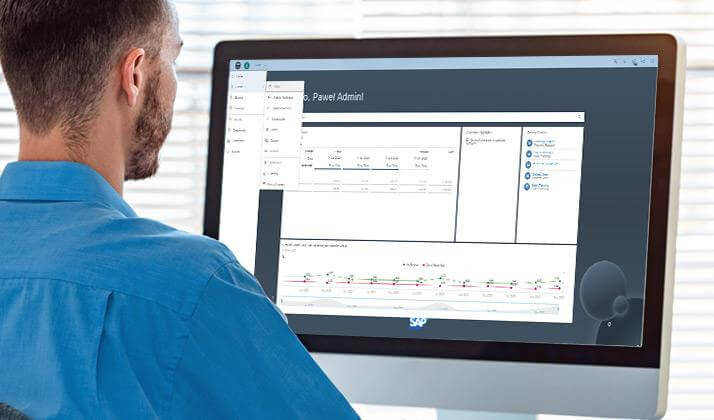
The system enables the live data system to connect with selected databases so that the data presented in the reports is constantly updated.
Due to the possibility of connecting many databases, the system enables them to be connected by two separate models.
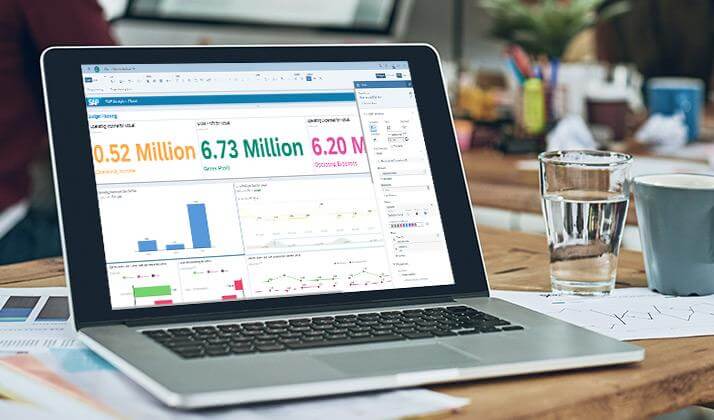
When building analyzes, the system allows you to use pie charts, line charts, key performance indicators (KPIs).
By creating new indicators, dimensions, and calculations from different data sources.
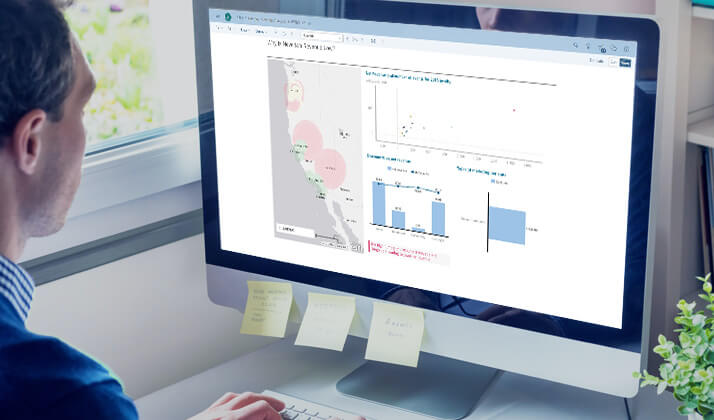
Along with the purchase of a license, we have access to many types of maps, thanks to which we can use our data to create infographics.
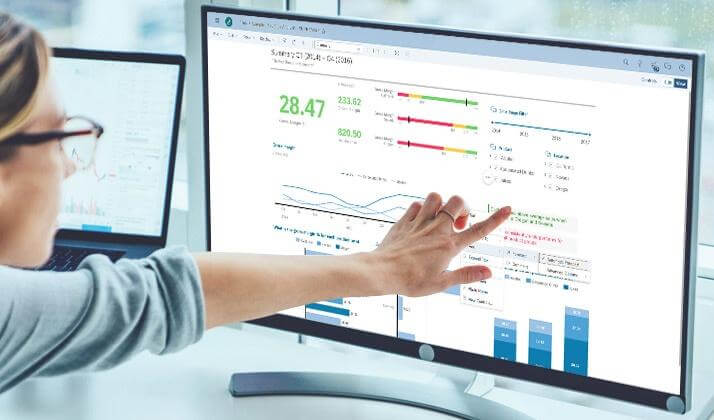
A button on the chart will activate a function thanks to which we will be able to quickly understand the complicated aspects of business data. Example: What affects revenue in the retail sector? The functionality will provide conclusions and explanations.
Functionality, thanks to which we will be able to enter, for example, an excel file into the system and select the measure (the element we want to measure, eg Net Value from the file), the system will present the dashboards by itself. Where the main business factors as well as hidden relationships and relationships between data will be shown.
By asking business questions in the system using natural language, the system will demonstrate the answers in the form of a visualization.
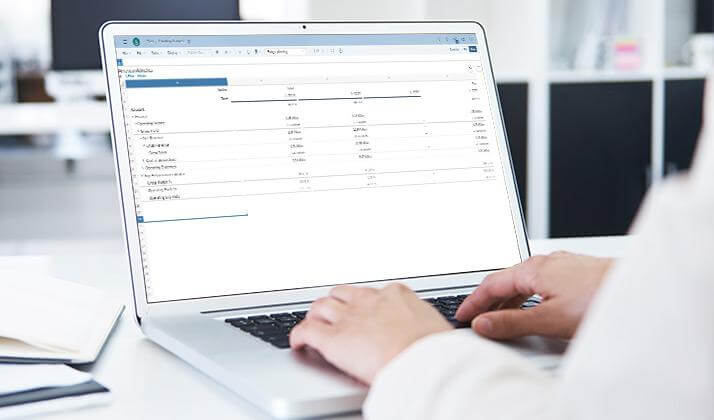
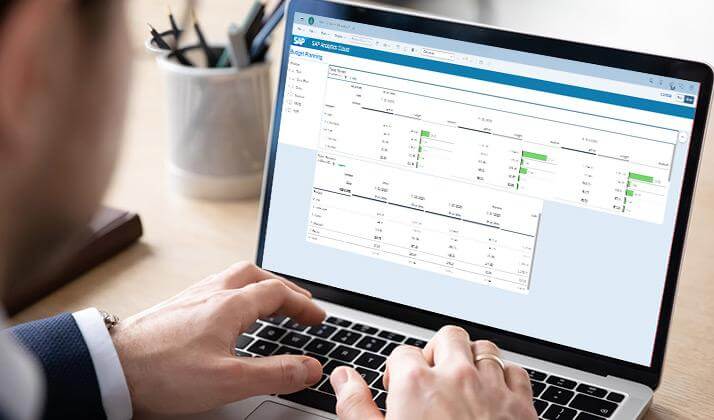
The tool collects all relevant data about the organization or the entire capital group, and then presents them in a clear manner

Simple and clear user interface
Quick access to information from anywhere in the world
Comprehensive support in making decisions
Support in the process of building the organization’s budget
We process orders of several thousand customers every month. This huge amount of information requires reliable IT support. SAP Business One copes well with this task.
Tomasz Sznajder, President of the Management Board of Primagran
Find out more
We were looking for an ERP-class financial and accounting program that would meet the requirements of an international capital group consisting of many companies in various parts of the world. This system was to ensure efficient handling of multiple currencies and language versions, and to enable the preparation of consolidated reports.
Izabella Nalewajek, Head of Group Accounting, G2A.COM
Find out more
We were looking for an ERP-class financial and accounting program that would meet the requirements of an international capital group consisting of many companies in various parts of the world. This system was to ensure efficient handling of multiple currencies and language versions, and to enable the preparation of consolidated reports.
Izabella Nalewajek, Head of Group Accounting, G2A.COM
Find out more
We wanted to improve the operation of the accounting system, as well as implement electronic document circulation, including approving contracts in the system or generating reports. That is why we decided on SAP Business One.
Cezary Waszkiewicz, Financial Manager, Adgar Poland
Find out more
We wanted to improve the operation of the accounting system, as well as implement electronic document circulation, including approving contracts in the system or generating reports. That is why we decided on SAP Business One.
Cezary Waszkiewicz, Financial Manager, Adgar Poland
Find out more
The price of purchasing and implementing the system is determined by many factors specific to the industry in which the organization operates as well as individual expectations and needs of the client. The price is also influenced by the software delivery model (local or in the cloud) and the method of settlement (subscription or one-time fee). To estimate the amount of investment in a solution tailored to your needs, the following process most often works:

Using the contact form or via chat, contact us and write what system you are interested in or what problem you want to solve.

In the second step, our account manager will contact you to arrange the details. Thanks to this, we will get to know your needs better and choose the right solution.

We present a solution configured for the needs of your company and its processes. During the presentation, we also most often specify the necessary functionalities.

Having full knowledge, we prepare a price offer for the purchase and implementation of the system and discuss it in detail.
Napisz do nas


